Internet marketing blogs routinely publish unrealistic cold email benchmarks, claiming you should expect 20% reply rates from cold strangers. Believing those inflated figures leads founders to scrap campaigns that are actually operating within healthy commercial bounds.
Across 40+ enterprise outbound campaigns and millions of delivered messages, real-world cold email metrics follow predictable conversion funnels. Managing inbox placement requires technical adherence to deliverability standards such as Yahoo Sender Best Practices.
The Realistic B2B Outbound Conversion Funnel
Here are the real metrics from live enterprise B2B campaigns in 2026:
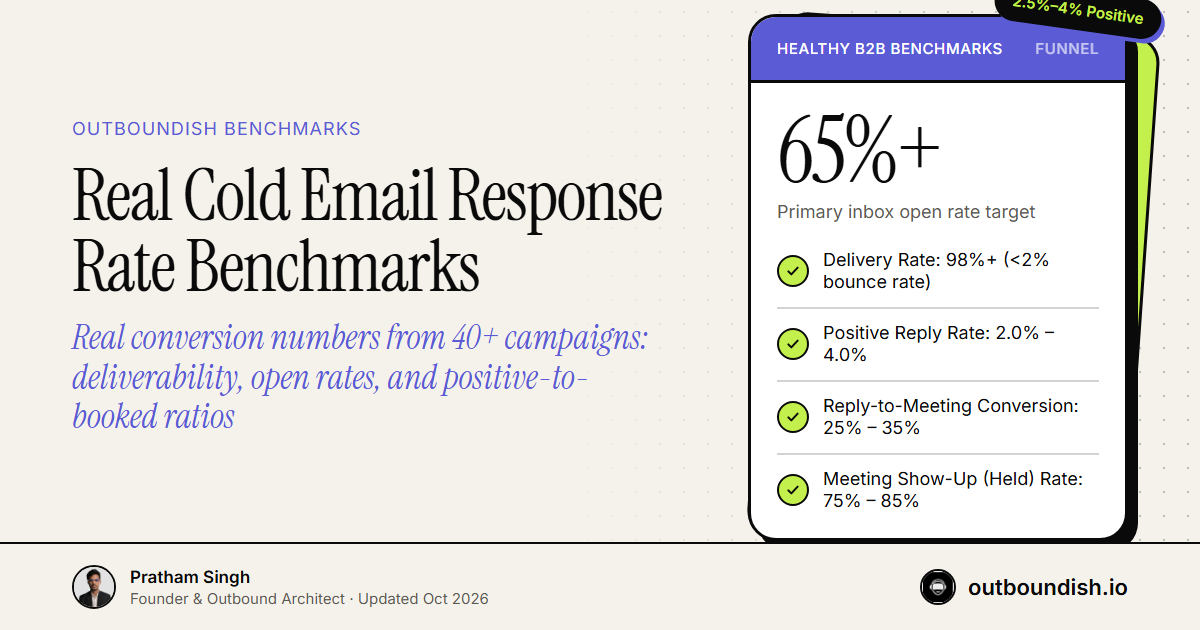
| Funnel Stage | Healthy Benchmark Range | Warning / Problem Zone | Underlying Cause of Failure |
|---|---|---|---|
| Delivery Rate | 98.0% – 99.5% | < 97.0% (Bounce > 3%) | Unverified email data; lack of waterfall verification |
| Open Rate | 60% – 75% | < 45% | Spam folder placement; unconfigured SPF/DKIM/DMARC |
| Total Reply Rate | 3.5% – 6.5% | < 1.5% | Irrelevant ICP targeting; 200+ word generic pitch copy |
| Positive Reply Rate | 2.0% – 4.0% | < 0.8% | Weak value proposition; aggressive CTA demanding 30 mins |
| Reply-to-Booked Rate | 25% – 35% | < 15% | Slow speed-to-lead (>2 hours); friction in meeting scheduling |
| Held Meeting Rate | 75% – 85% | < 60% | Loose qualification criteria; poor reminder cadence |
The Math: From 1,000 Cold Sends to Pipeline
To visualize how these benchmarks translate into real pipeline, trace a standard cohort of 1,000 verified prospect contacts:
1,000 Prospects Contacted (3-Touch Sequence)
    ├── 985 Delivered Successfully (98.5% Delivery)
    ├── 640 Opened (65.0% Open Rate)
    ├── 45 Replies Received (4.5% Total Reply Rate)
    │     ├── 20 Out of Office / Wrong Person
    │     └── 25 Substantive Human Responses
    ├── 15 Positive Opportunities (60% of Substantive Replies)
    ├── 5 Booked Sales Demos (33% Conversion)
    └── 4 Held Qualified Meetings (80% Show-Up Rate)
Why Open Rates Lie (And What to Measure Instead)
With Google and Microsoft deploying aggressive AI security proxies, open tracking pixels are increasingly unreliable.
Corporate mail servers open incoming messages automatically to check for phishing payloads, triggering false open events. At Outboundish, we evaluate campaign health on three metrics that cannot be faked: 1. Positive Reply Rate: Genuine expressions of human interest. 2. Qualified Held Meetings: Prospects who match your ICP and show up on video. 3. Pipeline Value Generated: Sourced sales pipeline entered into your CRM.
People Also Ask
Realistic cold email response rate benchmarks in 2026 are: 60% to 75% open rates (with custom tracking domain enabled), 3% to 6% total reply rates, 2% to 4% positive reply rates, and 25% to 35% conversion from positive replies to booked sales calls.
A true open rate between 60% and 75% indicates strong inbox placement and healthy domain reputation. Open rates below 40% signal deliverability trouble (landing in spam or promotional filters), while rates exceeding 85% usually indicate corporate bot pre-fetching.
On average, it takes 150 to 300 targeted, multi-touch cold emails across an account to book one qualified enterprise sales meeting. For high-ACV enterprise accounts ($50k+ ARR), that number can rise to 400 to 500 emails across multiple decision-makers.
Enterprise email security filters (like Microsoft Defender, Proofpoint, and Mimecast) routinely open incoming emails in virtual sandboxes to inspect links before delivering them to users. This generates artificial open events, making positive reply rates and held meetings the only true metrics of outbound success.
Keep Building The Engine
Want dedicated secondary inboxes, multi-pool mailbox rotation, and guaranteed primary placement managed for your team? Explore how our done-for-you cold email agency infrastructure pods run outbound without risking your domain portfolio.